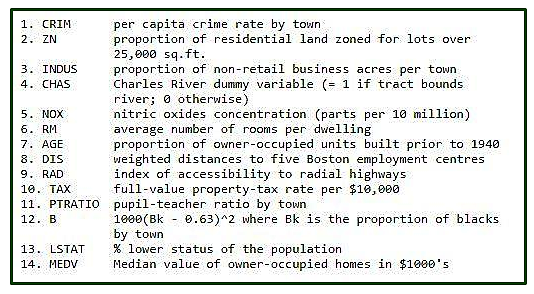
Boston Housing Data: This dataset is taken from the StatLib library and maintained by Carnegie Mellon University. The dataset relates to housing prices in Boston, the city of housing. The dataset provided has 506 instances and 13 features.
The dataset description is taken from
Let’s build a linear regression model to predict house prices
Input libraries and datasets.
# Importing Libraries
import numpy as np
import pandas as pd
import matplotlib.pyplot as plt

# Importing Data
from sklearn.datasets import load_boston
boston = load_boston()
Enter the shape of the Boston data and get the feature_names
boston.data.shape
boston.feature_names
Convert the data from nd-array to dataframe and add feature names to the data
data = pd.DataFrame(boston.data)
data.columns = boston.feature_names

data.head( 10 )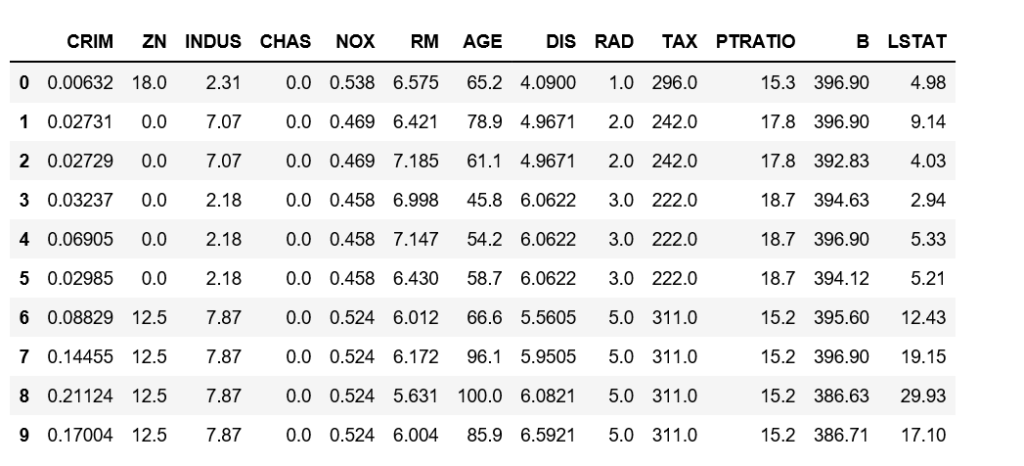
Add a Price column to the dataset
# Adding 'Price' (target) column to the data
boston.target.shape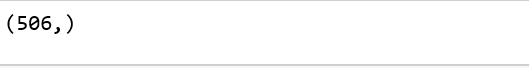
data[ 'Price' ] = boston.target
data.head()
Description of the Boston dataset
data.describe()
Boston dataset
data.info()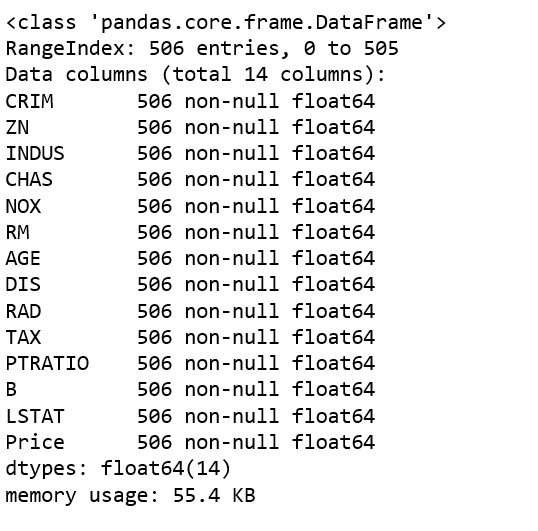
Get input and output data and further split the data into training and test datasets.
# Input Data
x = boston.data

# Output Data
y = boston.target


# splitting data to training and testing dataset.
from sklearn.cross_validation import train_test_split
xtrain, xtest, ytrain, ytest = train_test_split(x, y, test_size = 0.2 , random_state = 0 )

print ( "xtrain shape : " , xtrain.shape)
print ( "xtest shape  : " , xtest.shape)
print ( "ytrain shape : " , ytrain.shape)
print ( "ytest shape  : " , ytest.shape)
Apply a linear regression model to a dataset and predict prices.
# Fitting Multi Linear regression model to training model
from sklearn.linear_model import LinearRegression
regressor = LinearRegression()
regressor.fit(xtrain, ytrain)

# predicting the test set results
y_pred = regressor.predict(xtest)
Scatter plots are plotted to show the predictions – “ytrue” values vs. “y_pred” values
# Plotting Scatter graph to show the prediction
# results - 'ytrue' value vs 'y_pred' value
plt.scatter(ytest, y_pred, c = 'green' )
plt.xlabel( "Price: in $1000's" )
plt.ylabel( "Predicted value" )
plt.title( "True value vs predicted value : Linear Regression" )
plt.show()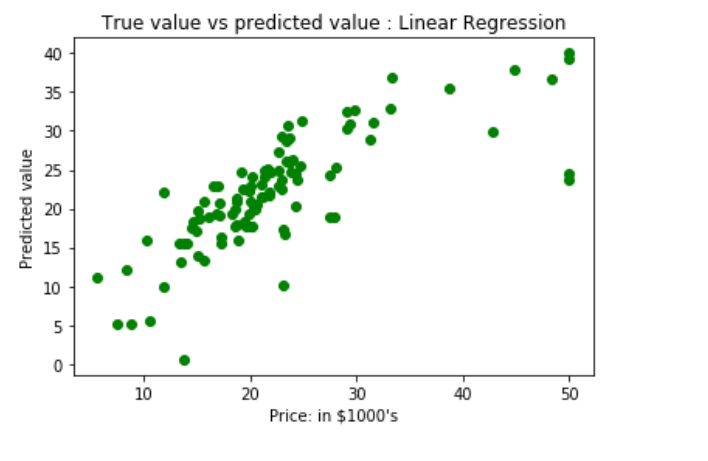
The result of linear regression, i.e., the mean square error.
# Results of Linear Regression.
from sklearn.metrics import mean_squared_error
mse = mean_squared_error(ytest, y_pred)
print ( "Mean Square Error : " , mse)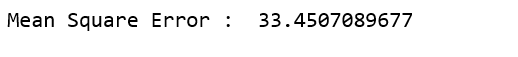
Based on the results, our model is only 66.55% accurate. Therefore, a prepared model is not very good for predicting the price of a house. There are many other possible machine learning algorithms and techniques that can be used to improve prediction results.
First, your interview preparation enhances your data structure concepts with the Python DS course.