Need to get descriptive stats for Pandas DataFrame? How does Pandas DataFrame get descriptive statistics?
If so, you can use the following template to get descriptive statistics for a specific column in a DataFrame:
df['DataFrame Column'].describe()Alternatively, you can use this template to get descriptive statistics for the entire DataFrame:
df.describe(include='all')In the next section, I’ll show you the steps to export descriptive statistics with an example.
Steps to get the descriptive statistics of the Pandas DataFrame
Step 1: Collect data
First, you’ll need to collect data for the DataFrame. For example, I collected the following data about cars:
| Brand | Price | Year |
| Honda Civic | 22000 | 2014 |
| Ford Focus | 27000 | 2015 |
| Toyota Corolla | 25000 | 2016 |
| Toyota Corolla | 29000 | 2017 |
| Audi A4 | 35000 | 2018 |
Step 2: Create a dataframe
Next, you’ll need to create a DataFrame based on the collected data.
For our example, the code to create the DataFrame is:
from pandas import DataFrame

Cars = {'Brand': ['Honda Civic','Ford Focus','Toyota Corolla','Toyota Corolla','Audi A4'],
        'Price': [22000,27000,25000,29000,35000],
         'Year': [2014,2015,2016,2017,2018]
        }

df = DataFrame(Cars, columns= ['Brand', 'Price','Year'])
print (df)
Run the code in Python and you’ll get this DataFrame:

Step 3: Get descriptive statistics for Pandas DataFrame
Once your DataFrame is ready, you’ll be able to get descriptive statistics using the template you saw at the beginning of this guide:
df['DataFrame Column'].describe()Let’s say you want to get descriptive statistics for the Price field that contains numeric data. In this case, the syntax you need to apply is:
df['Price'].describe()So the full Python code looks like this: Pandas DataFrame to get an example of descriptive statistics:
from pandas import DataFrame
Cars = {'Brand': ['Honda Civic','Ford Focus','Toyota Corolla','Toyota Corolla','Audi A4'],
'Price': [22000,27000,25000,29000,35000],
'Year': [2014,2015,2016,2017,2018]
}
df = DataFrame(Cars, columns= ['Brand', 'Price','Year'])
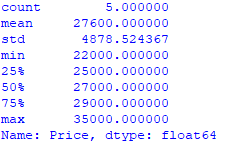
stats_numeric = df['Price'].describe()
print (stats_numeric)After you run the code, you’ll get descriptive statistics for the Price field:
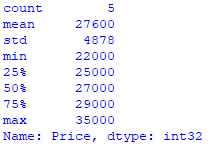
You will notice that the output contains 6 decimal places. You can then add the syntax of astype (int) to your code to get integer values.
Here’s what the code looks like:
from pandas import DataFrame

Cars = {'Brand': ['Honda Civic','Ford Focus','Toyota Corolla','Toyota Corolla','Audi A4'],
        'Price': [22000,27000,25000,29000,35000],
         'Year': [2014,2015,2016,2017,2018]
        }

df = DataFrame(Cars, columns= ['Brand', 'Price','Year'])

stats_numeric = df['Price'].describe().astype (int)
print (stats_numeric)
Run the code and you’ll only get integers:
Descriptive statistics of categorical data
How does Pandas DataFrame get descriptive statistics? So far, you’ve learned how to get descriptive statistics for numerical data. The Price field is used for this purpose.
However, you can also get descriptive statistics for categorical data.
For example, you can use the following code to get some descriptive statistics for the Brand field:
from pandas import DataFrame
Cars = {'Brand': ['Honda Civic','Ford Focus','Toyota Corolla','Toyota Corolla','Audi A4'],
'Price': [22000,27000,25000,29000,35000],
'Year': [2014,2015,2016,2017,2018]
}
df = DataFrame(Cars, columns= ['Brand', 'Price','Year'])
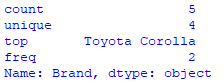
stats_categorical = df['Brand'].describe()
print (stats_categorical)Here’s what you’ll get:
Get descriptive statistics for the entire Pandas DataFrame
Finally, you can apply the following template to get descriptive statistics for the entire DataFrame:
df.describe(include='all')So the full Python code looks like this:
from pandas import DataFrame

Cars = {'Brand': ['Honda Civic','Ford Focus','Toyota Corolla','Toyota Corolla','Audi A4'],
        'Price': [22000,27000,25000,29000,35000],
         'Year': [2014,2015,2016,2017,2018]
        }

df = DataFrame(Cars, columns= ['Brand', 'Price','Year'])

stats = df.describe(include='all')
print (stats)
Run the code and you’ll get something like this:

Descriptive Statistics for Pandas DataFrame: Break down descriptive statistics
You can further break down the descriptive stats into the following:
Count:
df['DataFrame Column'].count()Average:
df['DataFrame Column'].mean()Standard Deviation:
df['DataFrame Column'].std()Minimum:
df['DataFrame Column'].min()0.25 quantile:
df['DataFrame Column'].quantile(q=0.25)0.50 quantile (median):
df['DataFrame Column'].quantile(q=0.50)0.75 Quartile
df['DataFrame Column'].quantile(q=0.75)Maximum:
df['DataFrame Column'].max()How does Pandas DataFrame get descriptive statistics? For our example, df[‘DataFrame Column’] is df[‘Price’].
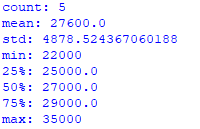
So, the full Python code for our example looks like this: Pandas DataFrame to get the descriptive statistics example:
from pandas import DataFrame

Cars = {'Brand': ['Honda Civic','Ford Focus','Toyota Corolla','Toyota Corolla','Audi A4'],
        'Price': [22000,27000,25000,29000,35000],
         'Year': [2014,2015,2016,2017,2018]
        }

df = DataFrame(Cars, columns= ['Brand', 'Price','Year'])

count1 = df['Price'].count()
print('count: ' + str(count1))

mean1 = df['Price'].mean()
print('mean: ' + str(mean1))

std1 = df['Price'].std()
print('std: ' + str(std1))

min1 = df['Price'].min()
print('min: ' + str(min1))

quantile1 = df['Price'].quantile(q=0.25)
print('25%: ' + str(quantile1))

quantile2 = df['Price'].quantile(q=0.50)
print('50%: ' + str(quantile2))

quantile3 = df['Price'].quantile(q=0.75)
print('75%: ' + str(quantile3))

max1 = df['Price'].max()
print('max: ' + str(max1))
After you run your code in Python, you’ll get the following statistics: