If you want to optimize your web server, it is essential to understand Nginx access logs and learn how to handle nginx access logs. Logging is the single critical action you take before you run into a problem. It also plays a role in detecting flaws in web development. Nginx access logs contain detailed information about user access requests. How Do I Handle NGINX Access Logs? To analyze and monitor your web server, you must parse Nginx access logs.
How to parse Nginx access logs
As a Linux user, there are two methods you can use to resolve your Nginx access. You can use Linux commands or use a log analyzer tool. Executing Linux commands will parse the Nginx access logs of the specified function, and you can get a full report when you parse the Nginx access logs using any analysis tool. This article will demonstrate two ways to parse Nginx access logs. So, let’s get started!
How to parse Nginx access logs to get a list of IP addresses
This section will show you how to use Linux commands to get a client IP address. If you want to know who is connecting to the server or when you want to see the IP address associated with a known troublemaker, the provided method of parsing Nginx access logs will be useful for you.
Considering that your Nginx access logs are saved in the “/var/log” directory, executing the command given below will parse the Nginx access logs to retrieve the list of IP addresses of the accessed users in the log file:
$ sudo cat /var/log/nginx/access.log | awk '{ print $1}' | sort | uniq -c | sort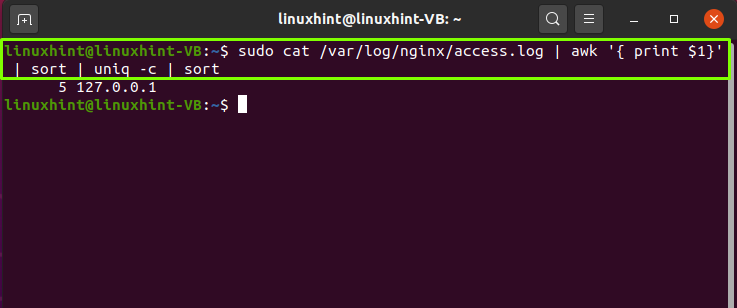
How to parse Nginx access logs to get a list of access files
Example of parsing nginx access logs: If you want to see the list of files accessed by users on the server, write the following given command in the terminal and press “Enter“:
$ sudo cat /var/log/nginx/access.log | awk '{ print $7}' | sort | uniq -c | sort
How to parse Nginx access logs to calculate the number of requests per second
How Do I Handle NGINX Access Logs? A coding genius can create a script that reads Nginx access log files, parses timestamps, and counts the number of requests per second. However, you can do the whole thing by executing a simple Linux command, which is:
$ sudo cat /var/log/nginx/access.log | awk '{print $4}' | uniq -c | sort -rn | headThe output of the above command will collate all the requests while adding a timestamp to each request. Here, the first number represents the request count:

nginx access log processing
How to parse Nginx access logs to get the response code
Example of parsing nginx access logs: When a web server receives a request from a website user, it returns a three-digit HTTP response status code. This code indicates the event that is about to occur. For example, a “301” response code means “Permanently moved,” while a “200” means “Okay, here’s what you’re requesting.” You can parse the Nginx access logs to get the response code. To do this, execute the following command in your Linux terminal:
$ sudo cat /var/log/nginx/access.log | cut -d '"' -f3 | cut -d ' ' -f2 | sort | uniq -c | sort -rn
How to parse Nginx access logs using an online analysis tool
Example of parsing nginx access logs: If you’re using Nginx as a static content server, load balancer, or web server, you’ll definitely want to look at your access logs to see how it’s performing. There are several options for log analysis tools, Nginx, such as Goaccess, Visitors, ELK stacks. You can choose the analysis tool according to your requirements.
However, to demonstrate the process of parsing Nginx access logs using an online analyzer tool, we chose Goaccess. To parse Nginx access logs using Goaccess, you must first install it on your system:
$ sudo apt install goaccess

nginx access log processing
How Do I Parse NGINX Access Logs? Use the Goaccess Analyzer tool: Goaccess includes real-time monitoring as well as an interactive terminal viewer. It’s built in C, which is why it’s fast, and takes advantage of the B+Tree database on disk to process logs step by step. The goal behind designing the Goaccess Analyzer tool was to provide something that could quickly perform log analysis on the terminal.
Goaccess generates metrics every 200 milliseconds. As a result, you can get an accurate picture of traffic conditions in real-time. When something isn’t working properly or there is an unexpected traffic spike, this feature comes in handy to find out the reason behind it. Goaccess will then determine if the problem is on the Nginx application or on the network.
How Do I Handle NGINX Access Logs? Instead of manually checking the Nginx access logs to find problems, you can take advantage of the most critical parsing information in the Nginx access logs by executing the following command:
$ goaccess /var/log/nginx/access.log
Now, select the log format and press “Enter” to continue:

Once you’ve selected the log format, you’ll be able to view the Goaccess Analyzer’s dashboard, which will display information related to the daily unique visitors, request files:

How Do I Parse NGINX Access Logs?
Goaccess will also provide you with information about static requests, URLs not found:

nginx access log processing
You can also see the hostnames and IPs of your website visitors, as well as their operating systems, browsers, and the amount of time they spend on the site:


How Do I Parse NGINX Access Logs?
Scroll down the Goaccess dashboard to see information related to referrers, referring sites, HTTP status codes, and key phrases from the Google search engine:

Example for parsing nginx access logs

Example for parsing nginx access logs
In the last section, we will see the geolocation data linked to our web server:

How Do I Handle NGINX Access Logs?
Summary of nginx access log processing
The access logs give you the information you need to determine what Nginx is doing. You can parse Nginx access logs to monitor, analyze, and optimize your web server. How Do I Parse NGINX Access Logs? If you’re a Linux user, you can parse Nginx logs using commands or Nginx parser tools. The profiler tool provides you with a complete report on the performance of your web server, while the execution of commands used to parse Ngnix access logs will only show you the output of the specified action. This article shows you how to parse Ngnix access logs using Linux commands and the Goaccess analyzer tool.v